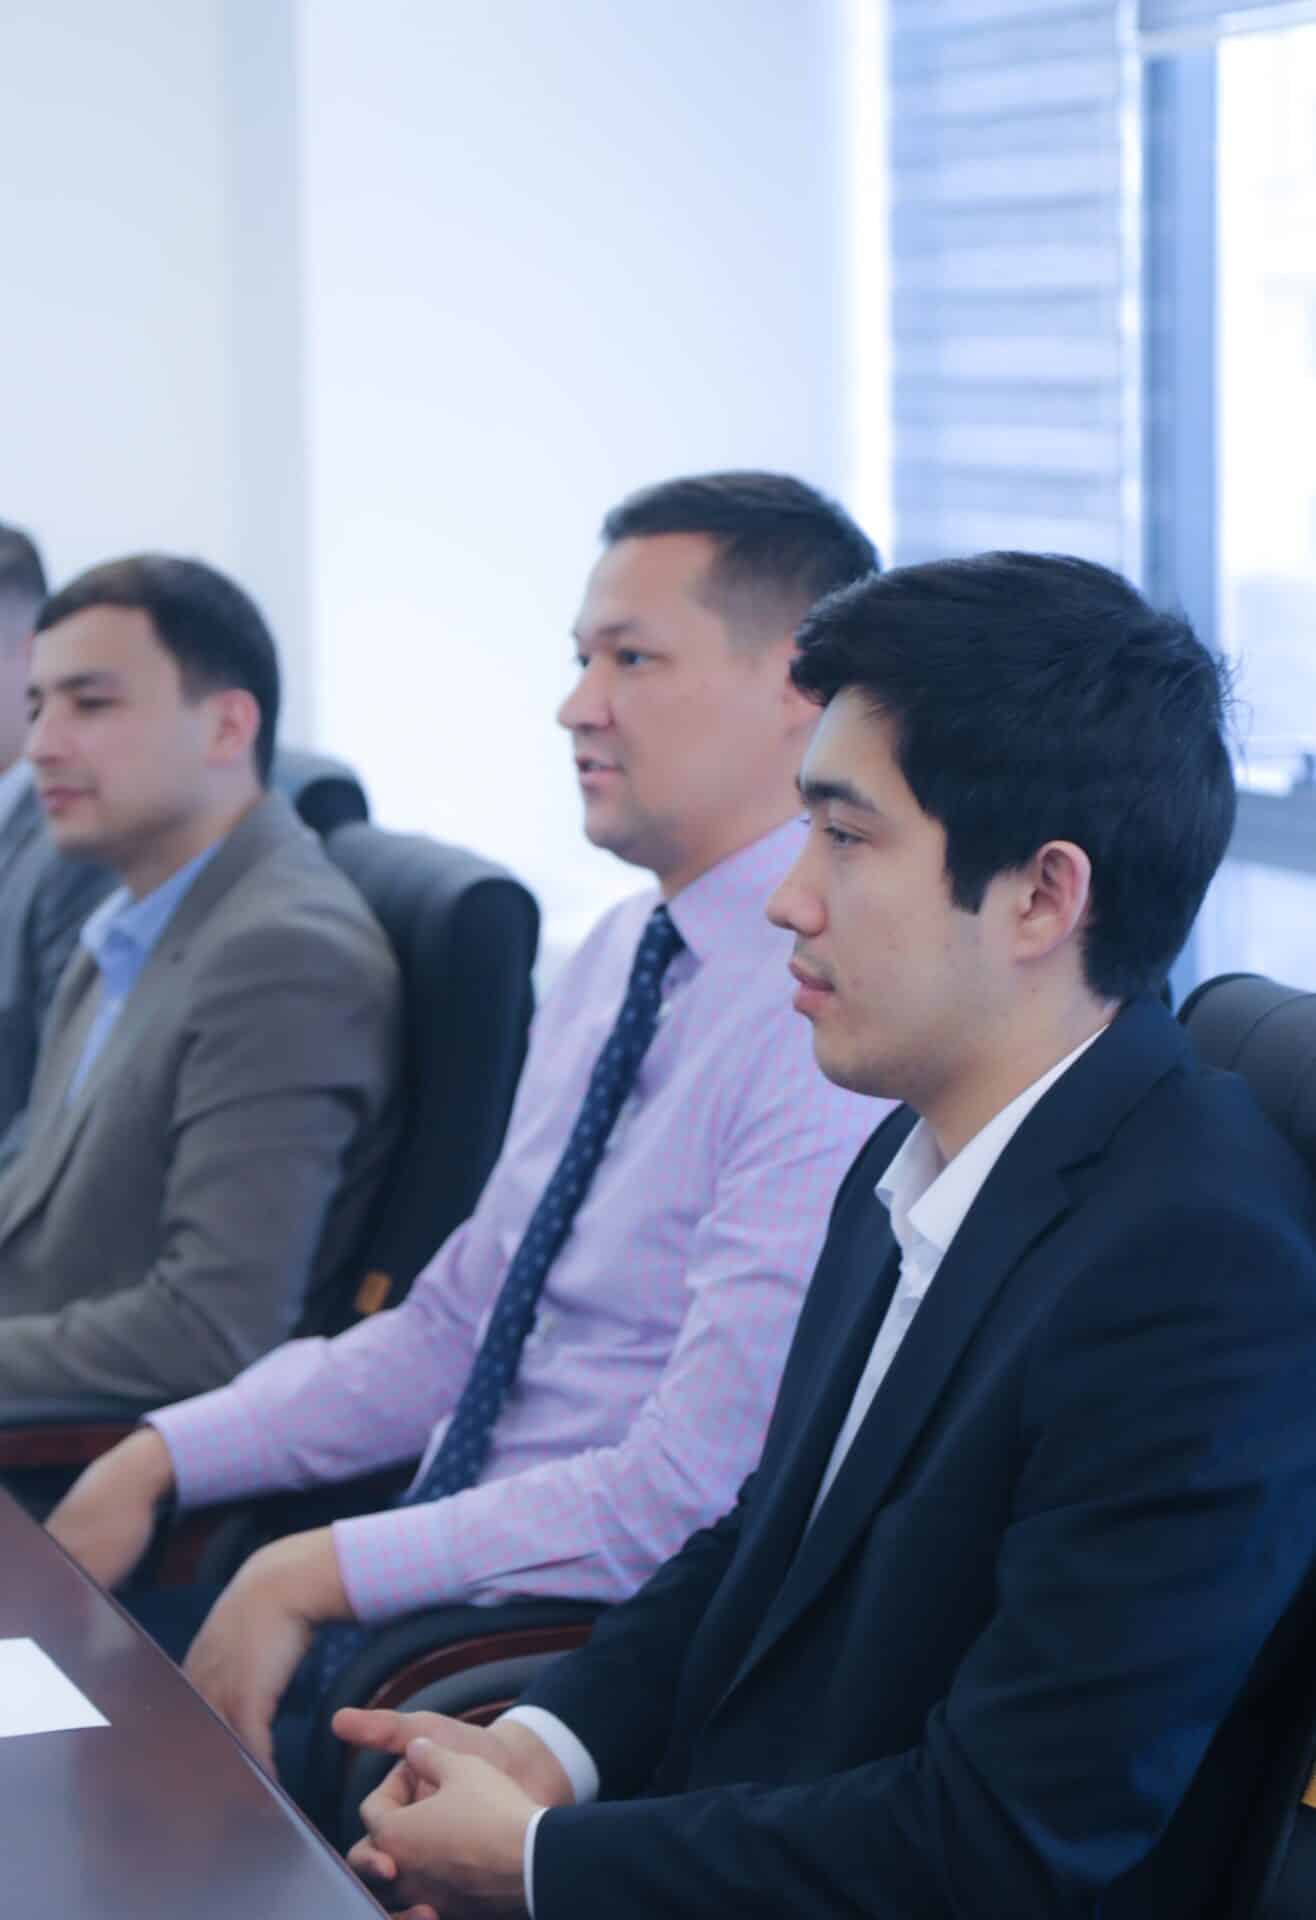
Olmazor Small Industrial Zone

JSC “Olmazor kichik sanoat zonasi”

“OLMAZOR SMALL INDUSTRIAL ZONE” JSC was established based on the Resolution of the President of the Republic of Uzbekistan dated May 18, 2017 No RP-2973 "On the establishment of small industrial zones in Tashkent". Its main activity is based on the long-term lease of tenant enterprises located on the company's territory, which creates favourable conditions for developing their production. The total area is 14.1 ha, the area of buildings and structures is 82 thousand square meters.

The company, through the Supervisory Board, leased 48.2 thousand square meters of manufacturing space on privileged terms to 52 small businesses and private entrepreneurs, including (enterprises producing textile and chemical products, food products, electrical goods, furniture, modern building materials, and other types of manufactured goods for domestic and foreign markets) in its territory.

The nominal stock price of "OLMAZOR SMALL INDUSTRIAL ZONE" JSC is 4 550 soums and the total number is 1 353 452. 

Production areas, buildings and land on the company's territory are leased to entrepreneurs for a long term of up to 10 years. Entrepreneurs also have the right to lease or privatise their land for another 10 years if they can complete their investment and other obligations on time. There are more than 30 production buildings and structures, as well as engineering and technical infrastructures in the territory of the society. The management of the small industrial zone is working to fulfil the task set by the Cabinet of Ministers to develop small business production, the introduction of higher technology, science and technology and the creation of favourable conditions for manufacturers in small industrial zones.

Financial indicators of JSC “Olmazor kichik sanoat zonasi”

Payout ratio of the net profit 
(According to NAS)

Payout ratio of the net profit 
(mln.soum)

Payout ratio of the net profit 
(According to NAS)

2022 (assumption)

827

75,05%

2021

546,8

75,05%

2020

749

75%


Indicators (in mln.UZS)

Change over previous year

2021

2020

2019

Revenue

+45%

6 382,1

4 383,2

3 149,6

Cost of sales

+172,3%

2 621,1

962,3

133,8

Gross Profit

+26%

4 313,2

3 420,9

3 015,7

Distribution costs


0,0

1,2

8,8

Administrative expenses

+65,6

3 265,9

1 971,4

2 974,9

Other operating income

-21%

1 094,1

1 382,4

2 346,2

Operating Profit

+27%

869,9

684,5

2 826,4

Income tax

+14,6%

165,0

143,9

-

Net profit

+8%

728,6

672,6

519,3


Olmazor Small Industrial Zone

Assets (in B UZS)
Equity/Liability (in B UZS)
Revenue/Net Profit (in B UZS)
ROA (%)
ROE (%)
EPS /Dividend per share (UZS)
Working capital ratio /Debt to equity ratio (Coef.)
Deterioration ratio/ Current financial independence ratio (Coef.)
Liquidity ratio (Coef.)
Нажмите на кнопку ниже, чтобы прослушать текст Powered by GSpeech